Когда цифр слишком много
Таблицы сложны тем, что они содержат очень много данных (в сегодняшней – 12 показателей), и не всегда легко их группировать.
Подход такой:
– выделите очевидные тренды
– не старайтесь упомянуть ВСЕ цифры, достаточно самых иллюстративных
– округляйте: если процент 55-56-58 как у меня – напишите “больше половины”
Вот мой вариант описания этой таблицы:
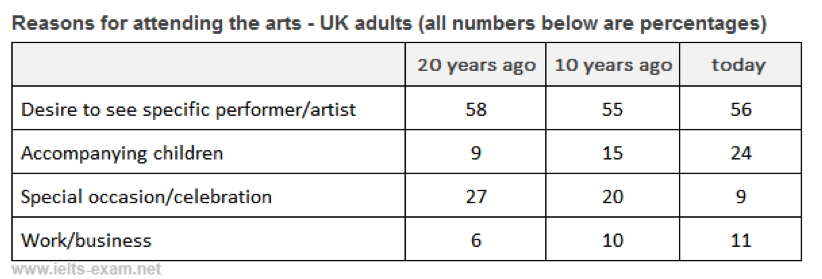
The presented table provides information about the reasoning for attending museums and art galleries among adult visitors living in the UK over a 20-year period.
Overall, art lovers were primarily motivated by an opportunity to marvel at a particular artist’s masterpieces, while only a negligible minority visited these exhibitions for business-related reasons. Besides this, the percentage of viewers who attended art places to accompany their children constantly grew through the whole studied period.
Turning to the details, it can be clearly seen that more than a half of visitors aimed to see a particular artist. In contrast, the percentage of accompanying children visitors was minimal 20 years ago but has grown dramatically from 9 to 24 by the present day. However, fewer and fewer people attended these places to celebrate a special event with a decline from 27% to only 9 %. Similarly, the lowest attendance rate was demonstrated by business people who accounted for only approximately one-tenth of the total visitors’ number.


БЕСПЛАТНО