IELTS Writing Task 1: описываем BAR CHART
Как правильно описать гистограмму (Bar Chart) в 3 шага на Band 7:
Шаг 1️⃣ перефразируем задание (я называю это предложение “Что? Где? Когда?”)
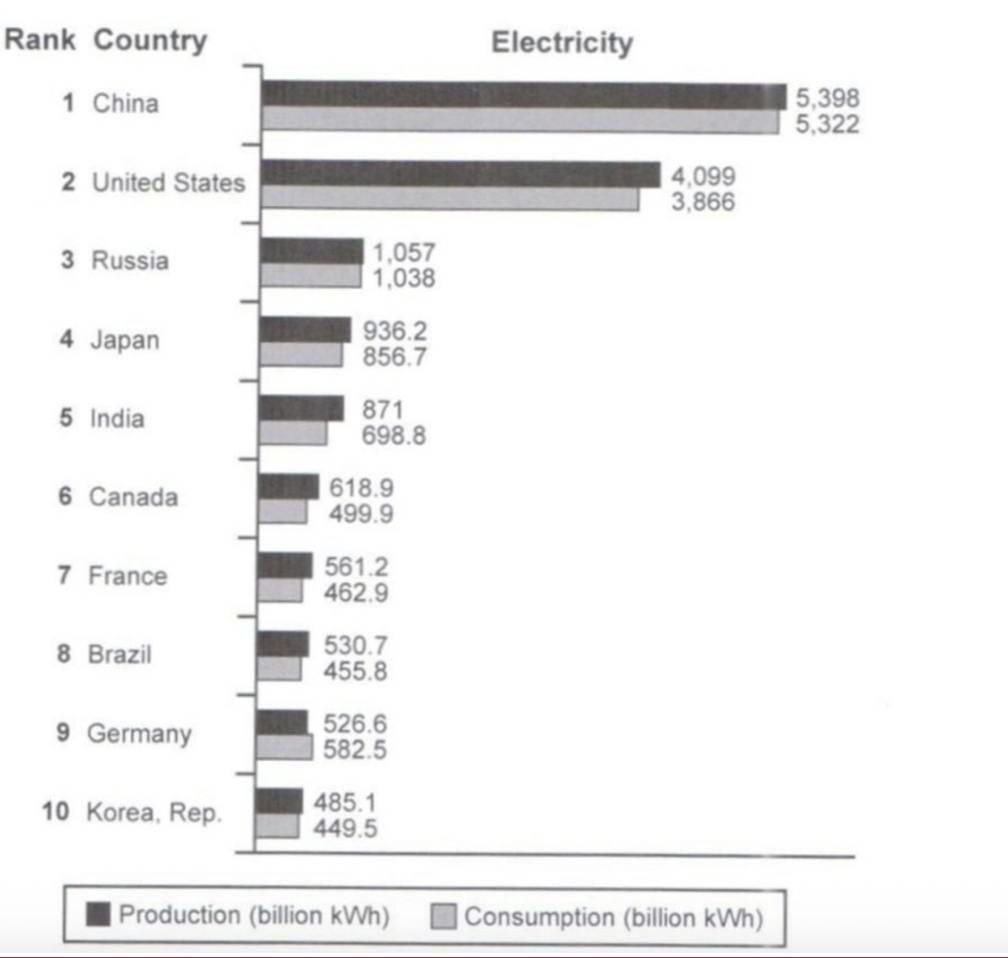
The presented bar chart demonstrates the amount of electricity produced and consumed in 10 regions in 2014.
Шаг 2️⃣ описываем 2 основных тренда в IELTS Bar Chart общими словами без деталей и цифр:
Overall, it can be clearly seen that all reported countries, with the exception of Germany, produced more power than required . In addition, China and the United States took the leading positions in both categories, while France, Canada, Brazil, Germany and Korea were by far the least productive states.
Шаг 3️⃣ Описываем детали графика, с цифрами, датами и сравнением трендов:
Now, turning to the details, it is observed that the total amount of energy produced by China and The United States was twice as much as by the other studied countries at approximately 9500 and 5300 kWh respectively. In contrast, figures for France, Brazil, Germany and Korea were relatively small, only around 500 kWh.
Another noticeable trend is that the number of kWh produced kWh slightly outnumbered the consumption rate in 9 countries, whereas Germany insignificantly exceeded the amount of power they produced by around 50 kWh.


БЕСПЛАТНО