IELTS Writing Task 1 BAR CHART в три шага
Описывая Bar Chart, определите – он описывает изменения за период времени или статичные данные (как в данном случае)?
Если динамические изменения – можно описывать рост/спад/колебания, но не в этом случае ![]()
Шаг 1️⃣ перефразируем задание (я называю это предложение “Что? Где? Когда?”)
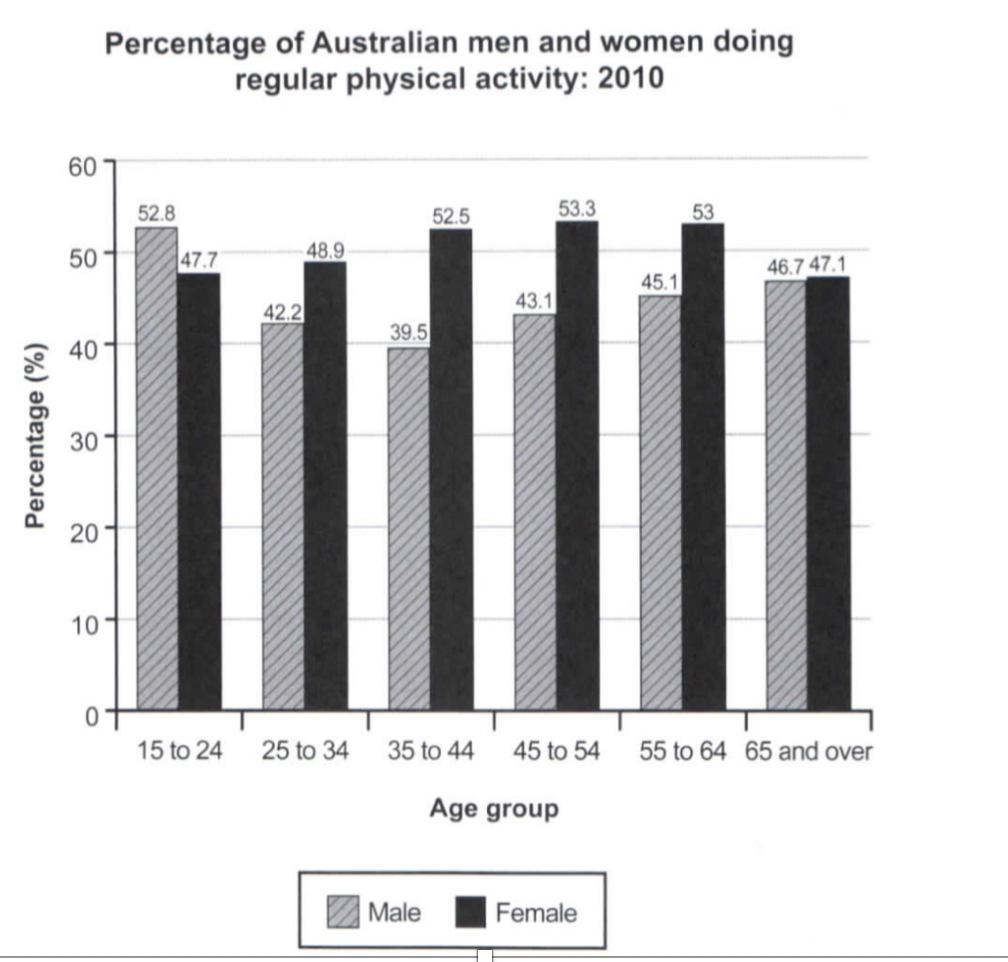
The presented chart provides comparative data on proportions of people taking exercises on regular basis in 2010 according to their gender.
Шаг 2️⃣ описываем 2 основных тренда в графике общими словами без деталей и цифр:
Overall, it can be observed that females were, by far, more active in all age groups with the exception of young adults’ category. In addition, middle-aged women were far more engaged in sport in contrast to their male peers.
Шаг 3️⃣ описываем детали графика, с цифрами, датами и сравнением трендов (можно одним или двумя абзацами):
Now, turning to the details, women who took exercise regularly outnumbered men in all age groups except the youngest one where the males’ rate was by 5% higher. According to the chart, the biggest difference was demonstrated by the category of 35 to 40 years olds and it accounted for approximately 13 per cent, 39.5 and 52.5 for men and women respectively. As shown in the chart, the most active age for women was 45-54 which peaked at just above 53 per cent. However, the figures were very similar among the elderly at around 47 per cent for both genders.
170 words


БЕСПЛАТНО