В первом задании письменной части вам может попасться таблица. IELTS writing task 1 table встречается довольно часто, поэтому стоит отдельно поработать с этим видом графиков. Помните, что task 1 составляет ⅓ от вашей оценки, и на его выполнение у вас будет 15-20 минут.
После того, как вы получили задание, не бросайтесь сходу прописывать всё, что видите, – это может стать фатальной ошибкой. Выдохните и, следуя ниже представленным шагам, начните работу с IELTS task 1 table.
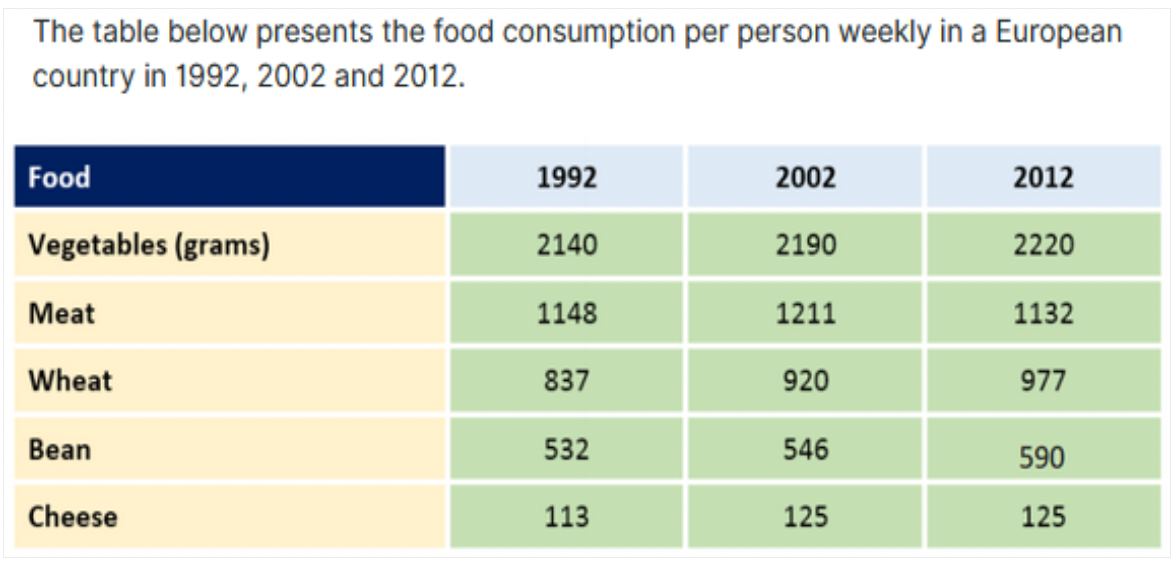
Покажу выполнение задания на примере таблицы о потреблении пищи в трех временных промежутках.
ШАГ 1: тренды
Внимательно смотрим на таблицу и выделяем основные тренды:
⁃ all the food types reported, except meat, showcased an increase in consumption
Здесь важно выделить главное, не вдаваясь в детали, их вы рассмотрите в смысловой части.
ШАГ 2: лидеры
Выделяем лидеров:
⁃ vegetables greatly outnumbered the other products in peoples’ ration
ШАГ 3: описание
После того, как анализ таблицы завершен, приступаем к выполнению задания: вписываем выделенные тренды и лидеров в структуру описания таблиц.
Описание таблицы имеет 3 части:
- Пишем первое предложение, которым в нашем случае будет служить перефразирование задания:
The table provides data on …
- Во втором предложении указываем наш общий вывод/summary по нашему ielts task 1 table – оverview, где пишем основные тренды и лидеров:
Overall, …
- За вступлением и оverview следуют 2 параграфа, где мы группируем и описываем все key features, подкрепляя все данными.
IELTS writing task 1 table samples
Ниже – пример описания данной таблицы на 7+ баллов:
The table compares the amount of food, in five categories, consumed by a person in a European country per week, over a 20-year period between 1992 and 2012.
Vegetables were the most popular food, hovering around 2000 grams per week. Their consumption witnessed a sustainable growth over the period, starting from 2140 grams in 1992, followed by a significant increase to 2190 grams in 2002 and 2200 grams in 2012. Being the second most popular food, meat experienced the biggest changes in its consumption. Having started at just under 1150 grams per week, it peaked at 1211 grams in 2002, after which the consumption of this food plunged to 1132 grams in 2012.
The intake of the other three products was not nearly as big as the above mentioned types of food. Although the amount of wheat in the ration jumped by 60 grams in 2002, reaching 920 grams, the following rise was more gradual and its consumption accounted for 977 grams in 2012. Similarly, the consumption of beans went up unsteadily: after a marginal climb from 532 grams to 546 grams during the first decade, it jumped to 590 grams in 2012. Cheese was the least consumed product, whose consumption plateaued at 125 grams after a negligible growth from the initial amount of 113 grams per week in 1992.
Вариантов IELTS writing task 1 table великое множество, и на Boosty мы еженедельно разбираем самые свежие из попадающихся на экзаменах. Присоединяйтесь, чтобы научиться описывать любой график за 15 минут.


БЕСПЛАТНО