Шаг 1 перефразируем задание (я называю это предложение «Что? Где? Когда?»):
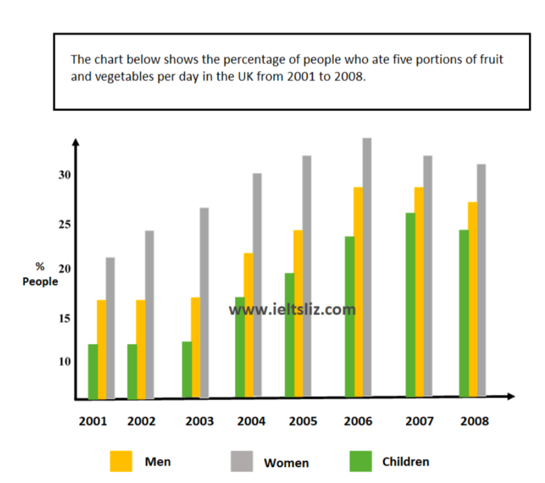
The presented chart provides data on the consumption of vegetables and fruit in 3 studied groups according to age and gender in an 8-year period in the UK.
Шаг 2️⃣ описываем 2 основных тренда в графике общими словами без деталей и цифр:
Overall, all researched categories of consumers experienced similar upward trends throughout the whole period, with the highest point in 2006-2007. Another noticeable trend is that women, in general, consumed by far more vegetables than males and youngsters.
Шаг 3️⃣ описываем детали графика, с цифрами, датами и сравнением трендов (можно одним или двумя абзацами):
Turning to the details, the female group demonstrated a steady surge in the first 6 years, their rate almost doubled, having reached a peak in 2006 and 2007 at 35%. In contrast, the male and the youngest categories demonstrated a 3-year plateau at 18% and 12% respectively, which was followed by a rapid surge from 2004 to 2006. However, this growth was changed with a moderate decline of 2-3 percent for all groups at the end of the period.
Besides this, as shown in the chart, women noticeably outnumbered the other 2 categories, showing approximately twice as high fruit and vegetable consumption rate as children. 171


БЕСПЛАТНО