IELTS Pie Chart – 3 types of nutrients
Разберем круговые диаграммы из самого свежего июльского сборника IELTS CAMBRIDGE 14:
Шаг 1 перефразируем задание (я называю это предложение «Что? Где? Когда?»):
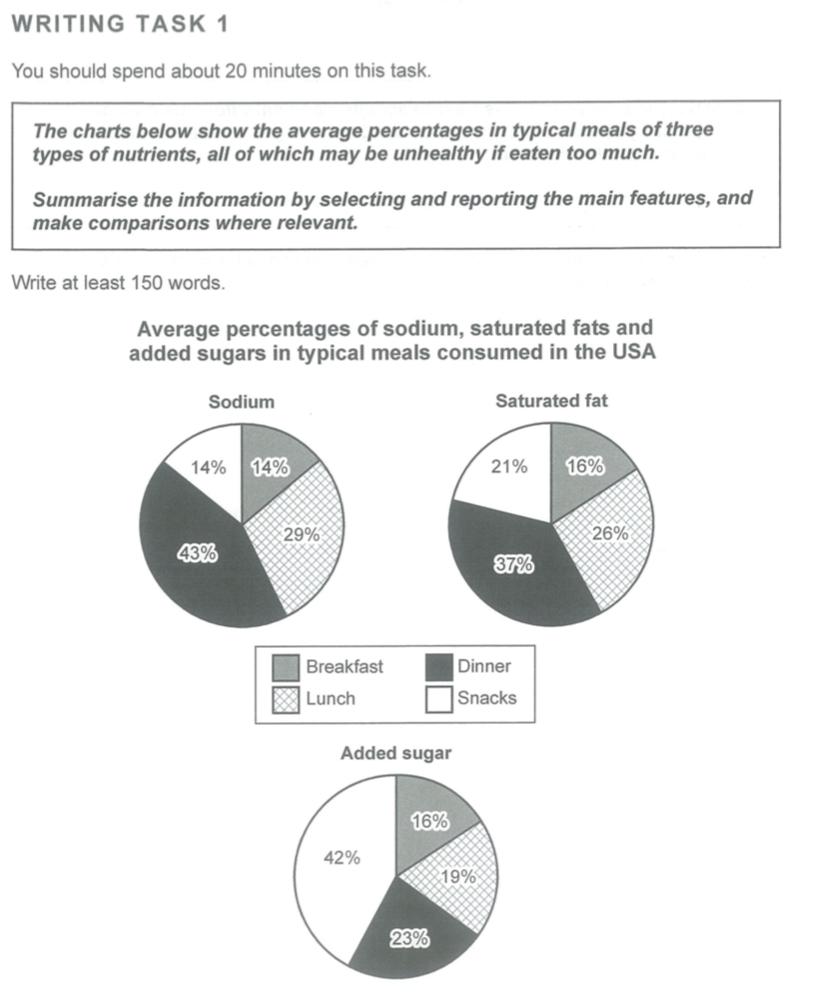
The presented chart illustrates the consumed proportions of 3 potentially harmful if eaten in quantitysubstances: sodium, saturated fat and added sugars in the US. The data is shown for 3 main meals and snacks.
Шаг 2 описываем 2 основных тренда в графике общими словами без деталей и цифр:
Overall, it is obviously clear that dinner makes up the largest consumption of additives, while only a tiny percentage is eatenwith the average breakfast. Another noticeable trend is that snacks, being rich in sugar, account for around a half of daily consumption of sugar.
Шаг 3 описываем детали графика, с цифрами, датами и сравнением трендов (можно в один или 2 параграфа):
Now, turning to the details, it can be clearly seen that a US citizens’ dinner is reported for just under a half of sodium, a third of Saturated fat and roughly a quarter of sugar consumption: 43, 37 and 23 % respectively. In contrast, breakfast’s shares demonstrate equal proportions of these three substances of approximately 15%. Beside this, according to statistics, the dominating proportion of sugar is averagely consumed between main meals, as snacks are reported for 42 per cent of this ingredient. 156


БЕСПЛАТНО